Tennessee's 9th congressional district
| Tennessee's 9th congressional district | |
|---|---|
Interactive map of district boundaries since January 3, 2023 | |
| Representative | |
| Distribution |
|
| Population (2023) | 747,578[2] |
| Median household income | $53,598[3] |
| Ethnicity |
|
| Cook PVI | D+22[4] |
Tennessee's 9th congressional district is a congressional district in West Tennessee. It has been represented by Democrat Steve Cohen since 2007.
The district was re-created as a result of the redistricting cycle after the 1980 census. The district is almost exclusively urban, due to its mostly cohabitant nature with Memphis.
Memphis is recognized worldwide for being the hub for FedEx. Largely due to FedEx's presence, Memphis International Airport handles more cargo than any other airport in the country. Memphis is also known for blues music, Beale Street, and barbecue.
It is the only majority minority congressional district in Tennessee. With a Cook Partisan Voting Index rating of D+22, it is the only Democratic district in Tennessee.[4] Since 1875, the area has sent mostly Democrats to Congress with the exception of a brief period from 1967 to 1974 when it was represented by Republican Dan Kuykendall.
Current boundaries
[edit]Beginning in 2023, the district covers most of Shelby County, where the city of Memphis is located. It also includes just under half of Tipton County.
It begins north on the border with Lauderdale County and encompasses part of Covington. It then travels south to the district's anchor city of Memphis. Nearly all of Memphis is in the 9th, although most of the city's eastern portion spills over into the 8th. The district then juts out east to grab Cordova, but mostly avoids Bartlett and Germantown. The district is bounded on the west and south by Arkansas and Mississippi respectively.
Election results from statewide races
[edit]Results under older lines (1993–2023)
| Year | Office | Result |
|---|---|---|
| 2000 | President | Al Gore 63% - George W. Bush 36% |
| 2004 | President | John Kerry 70% - George W. Bush 30% |
| 2008 | President | Barack Obama 77% - John McCain 22.5% |
| 2012 | President | Barack Obama 78.4% - Mitt Romney 21% |
| 2016 | President | Hillary Clinton 77.5% - Donald Trump 19.8% |
| 2020 | President | Joe Biden 78.5% - Donald Trump 19.9% |
Results under new lines (2023–2033)
| Year | Office | Result |
|---|---|---|
| 2024 | President | Kamala Harris 70.84% - Donald Trump 27.38% |
History
[edit]Arguably, the district's current characteristics began to take shape in 1925 — the first year a congressional district consisted exclusively of Shelby County.
A congressional district was perfectly coextensive with Shelby County from 1925 until 1966, numbered as the 10th from 1925 to 1933 and from 1943 to 1953, then the 9th from 1933 to 1943 and the 9th from 1953 to 1966.
In 1966, the Supreme Court case Baker v. Carr took effect. In that ruling, the court laid out a "one man, one vote" standard. Prior to 1966, the 9th was nearly ten times larger in population than the nearby 7th and 8th.
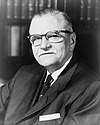
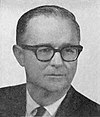
1967 was the first year where the district covered merely a fraction of Shelby County rather than the county's entirety. In that election, the district chose former US Senate Republican nominee Dan Kuykendall. The district was renumbered the 8th in 1973 and was pushed further into Memphis. In 1974, in the midst of Watergate, Kuykendall supported Nixon throughout the scandal, and was subsequently defeated by Democrat Harold Ford Sr., whose family had strong political ties in Memphis dating back to at least the 1920s.
The district has voted Democratic in every congressional race since 1974. The Democrats consolidated their hold on the seat when the 1980 census saw it become the 9th once again. Since then, it has been drawn as a black-majority district.
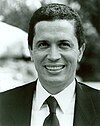
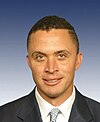
Ford served in Congress for 22 years, when he was replaced by his son — Harold Ford Jr. — in 1997. The younger Ford served for ten years, until he mounted an unsuccessful bid for US Senate. Concurrent to Ford's senate bid, the district chose state senator Steve Cohen over Ford's brother Jake.[5] Cohen is noted for being Tennessee's first Jewish congressman, and has been elected seven times for a little over fourteen years in Congress.
List of members representing the district
[edit]Recent election results
[edit]2012
[edit]| Party | Candidate | Votes | % | |
|---|---|---|---|---|
| Democratic | Steve Cohen (Incumbent) | 188,422 | 75.1% | |
| Republican | George S. Flinn, Jr. | 59,742 | 23.8% | |
| Independent | Brian L. Saulsberry | 1,448 | 0.6% | |
| Independent | Gregory M. Joiner | 1,372 | 0.5% | |
| Total votes | 250,987 | 100% | ||
| Democratic hold | ||||
2014
[edit]| Party | Candidate | Votes | % | |
|---|---|---|---|---|
| Democratic | Steve Cohen (Incumbent) | 87,376 | 75% | |
| Republican | Charlotte Bergmann | 27,173 | 23.3% | |
| Independent | Floyd Wayne Alberson | 766 | 0.7% | |
| Independent | Paul Cook | 752 | 0.6% | |
| Independent | Herbert Bass | 483 | 0.4% | |
| Total votes | 116,550 | 100% | ||
| Democratic hold | ||||
2016
[edit]| Party | Candidate | Votes | % | |
|---|---|---|---|---|
| Democratic | Steve Cohen (Incumbent) | 171,631 | 79% | |
| Republican | Wayne Alberson | 41,123 | 18.9% | |
| Independent | Paul Cook | 5,203 | 2.4% | |
| Total votes | 217,957 | 100% | ||
| Democratic hold | ||||
2018
[edit]| Party | Candidate | Votes | % | |
|---|---|---|---|---|
| Democratic | Steve Cohen (Incumbent) | 145,139 | 80% | |
| Republican | Charlotte Bergmann | 34,901 | 19.2% | |
| Independent | Leo AwGoWhat | 1,436 | 0.8% | |
| Total votes | 181,476 | 100% | ||
| Democratic hold | ||||
2020
[edit]| Party | Candidate | Votes | % | |
|---|---|---|---|---|
| Democratic | Steve Cohen (Incumbent) | 187,905 | 77.4% | |
| Republican | Charlotte Bergmann | 48,818 | 20.1% | |
| Independent | Dennis Clark | 3,962 | 1.6% | |
| Independent | Bobby Lyons | 2,192 | 0.9% | |
| Total votes | 242,880 | 100% | ||
| Democratic hold | ||||
2022
[edit]| Party | Candidate | Votes | % | |
|---|---|---|---|---|
| Democratic | Steve Cohen (incumbent) | 93,800 | 70.0% | |
| Republican | Charlotte Bergmann | 35,123 | 26.2% | |
| Independent | George Flinn | 3,349 | 2.5% | |
| Independent | Dennis Clark | 1,160 | 0.8% | |
| Independent | Paul Cook | 485 | 0.3% | |
| Write-in | Bobby Lyons | 1 | 0.0% | |
| Total votes | 133,918 | 100% | ||
| Democratic hold | ||||
Historical district boundaries
[edit]


See also
[edit]References
[edit]- ^ "Congressional Districts Relationship Files (state-based)". www.census.gov. US Census Bureau Geography.
- ^ "My Congressional District". www.census.gov. Center for New Media & Promotion (CNMP), US Census Bureau.
- ^ "My Congressional District".
- ^ a b "2022 Cook PVI: District Map and List". Cook Political Report. Retrieved January 10, 2023.
- ^ "U.S. HOUSE OF REPRESENTATIVES / TENNESSEE 09". America Votes 2006. CNN.
- ^ "2012 Election Results" (PDF). Clerk of the United States House of Representatives. Retrieved October 23, 2022.
- ^ "2014 Election Results" (PDF). Clerk of the United States House of Representatives. Retrieved October 23, 2022.
- ^ "2016 Election Results" (PDF). Clerk of the United States House of Representatives. Retrieved October 23, 2022.
- ^ "2018 Election Results" (PDF). Clerk of the United States House of Representatives. Retrieved October 23, 2022.
- ^ "2020 Election Results" (PDF). Clerk of the United States House of Representatives. Retrieved October 23, 2022.
- Martis, Kenneth C. (1989). The Historical Atlas of Political Parties in the United States Congress. New York: Macmillan Publishing Company.
- Martis, Kenneth C. (1982). The Historical Atlas of United States Congressional Districts. New York: Macmillan Publishing Company.
- Congressional Biographical Directory of the United States 1774–present


